Issue No. 151
Welcome to the latest issue of Carbon Creed - a curated newsletter for the carbon-minded reader.
Happy New Year!
(source: Vox)
The clean energy transition in 7 charts
Kudos to the team of writers, editors, and artists at Canary Media behind the data presented herein. They bring some of the best reporting on the clean energy transition, and we thank them for it. Their original analysis featured 10 charts, which I curated down to my top 7.
My hope is that these data will inspire and reassure you that we can decarbonize as a society, if we have committed leadership who make the right choices. Enjoy!
1. The Inflation Reduction Act (IRA) has sparked a U.S. manufacturing boom
The Inflation Reduction Act, signed into law in August 2022, aimed to bring a clean energy manufacturing boom to the U.S. through generous subsidies. So far, the climate law is working: In its first year, more than 100 new clean energy manufacturing facilities or factory expansions were announced, adding up to nearly $80billion in new investment from private companies. Can you guess where most of that investment is going? Here’s a hint: peaches and peanuts.
2. Clean energy costs keep trending down, down, and down…
While fossil fuels have not gotten cheaper with time, clean energy costs have plummeted over the past few decades. That’s made them more cost-effective than fossil fuels in many cases — and also more attractive to new investments. These cost declines are not expected to stop anytime soon. In fact, by 2030, technology improvements could slash the price of wind by a quarter and of solar by half.
3. The stakes are highest in the States
The United States is not currently on track to meet its goal of cutting emissions in half by 2030. But if the 24 states that have targets of their own can meet those pledges, the country could get pretty close to that national goal. The problem? Those states are also currently not on track to meet their targets.
4. Solar is soaring across the U.S.
Solar installations are skyrocketing in the United States, and this reader-favorite map shows where many of the country’s utility-scale solar systems are located. The map reveals a high concentration of solar in Massachusetts and North Carolina, though when accounting for power-generating capacity, California and Texas are far ahead of the rest of the country.
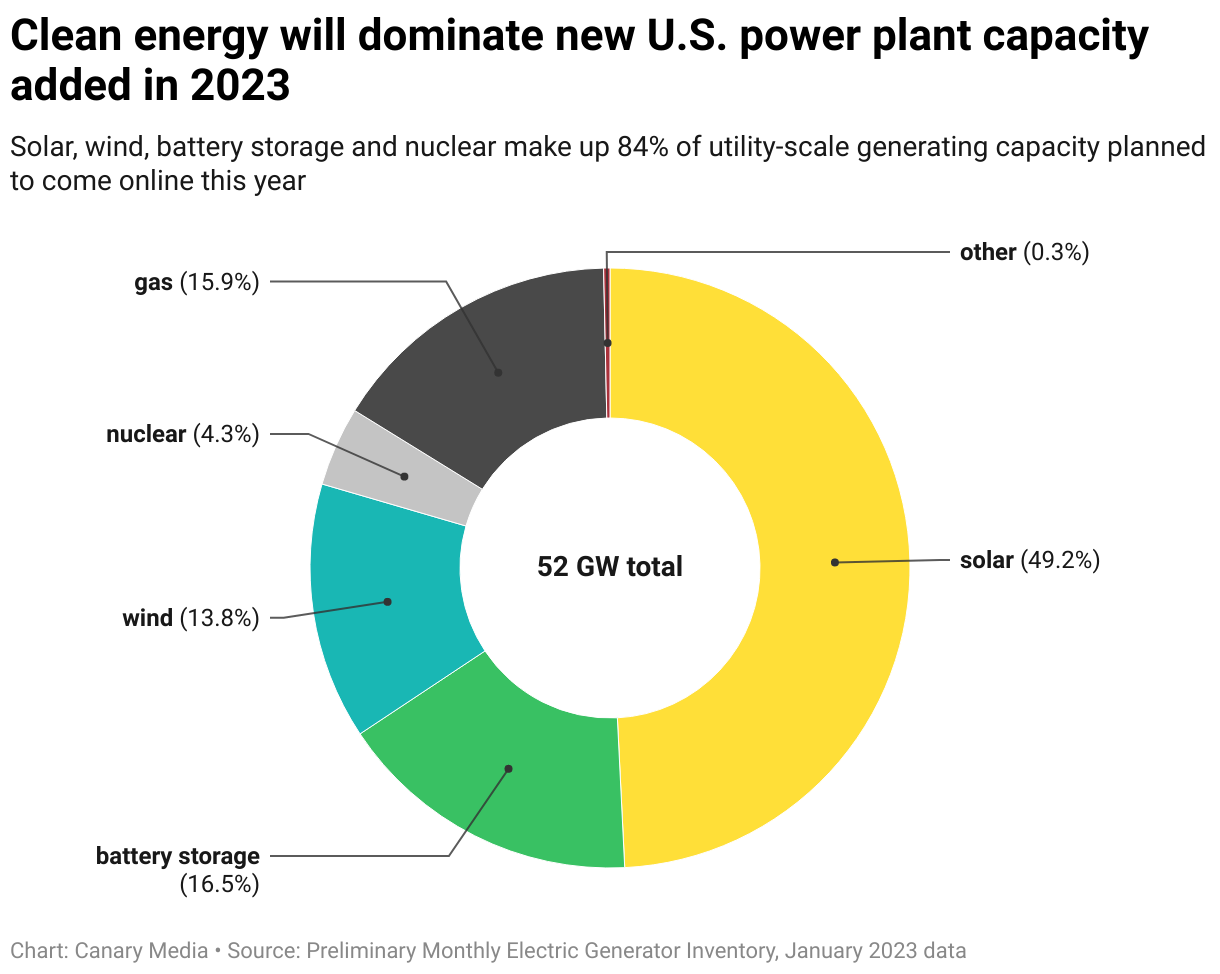
5. Clean Power rules new U.S. power capacity
Though they still make up just 20 percent of overall power generation, solar, batteries and wind account for the most new power flowing to the U.S. grid — and it’s not even close. In 2023, clean energy will have accounted for the 84% of all new power capacity added to the U.S. grid, while fossil-fueled plants will make up just 16 percent of new capacity.
6. U.S. EV sales are setting new records
Despite recent gloomy headlines, the U.S. electric-vehicle market is actually well past the tipping point for mass adoption, and EV sales in the U.S. surpassed the 1 million mark for the first time this year. That trend is likely to be helped along by federal and state rebates for EVs — plus price drops from automakers, all of which have brought EVs closer than ever in price to cars with internal combustion engines. In some cases, they’re actually cheaper.
7. Global renewables deployments are at record level
Though these charts tend to focus on the U.S., the energy transition is not just happening in America. Just take a look at renewable installations around the world in 2023, which are projected to hit a new record of more than 400 gigawatts in total — a 100-gigawatt jump from 2022. The enormous amount of new power capacity is mostly from solar, both distributed and utility-scale, and onshore wind — and mostly based in China.
[This post was adapted from the original written by Maria Virginia Olanor for Canary Media]
We’ll keep you posted on the latest carbon and climate insights as they happen.
If you have an opinion on any topic covered in this newsletter, please feel free to send me an email at mcleodwl@carboncreed.com.
Thank you for your viewpoint and the value of your time.
RESOURCES
The Science of Climate Change Explained: Facts, Evidence and Proof, published by the New York Times
Currents a podcast featuring in-depth discussions with experts on clean energy and sustainability, published by Norton Rose Fulbright.
Matter of Fact, a weekly newsmagazine that focuses on socioeconomic and climate issues in America, hosted by veteran journalist Soledad O'Brien.
Advancing Inclusion Through Clean Energy Jobs a report by the Brookings Institute.
Congressional Policy Tracker a summary of current federal energy legislation.
Click Clean your favorite apps and tech company clean power rankings.
The Keeling Curve a daily record of global atmospheric CO2 concentration.


